
An October update about a September event
NASA’s October 29 update says researchers are helping the Virginia Marine Resources Commission assess oyster-farm impacts after September’s harmful algal bloom. The team used Copernicus Sentinel-2 imagery to map elevated algae concentrations and the Chesapeake Bay Environmental Forecast System to reconstruct environmental conditions. This is a new account of an assessment of an earlier event, rather than an announcement of a new outbreak.
That timing matters when reading the result. A report about damage can appear after the visible water conditions have changed. Its value may lie in reconstructing an exposure or improving preparation for another event. Readers should keep the period being investigated separate from the date on the article or the latest map.
Source notes: 1. Original editorial examples and interpretations are identified separately.
A water-colour signal and a species identification differ
VIMS’s September 22 field account describes water sampling along Virginia’s Eastern Shore and identifies Alexandrium monilatum among the algae present. It reports oyster mortality and fish deaths occurring alongside the bloom while keeping the relationship under investigation. Its account does not turn co-occurrence into a completed explanation for every loss.
The distinction gives the different observations useful jobs. A regional image can help show where to investigate. A sample can address what organisms were present at a particular place and time. A farm record can describe what happened to stock there. Agreement among these records is more informative than treating any one of them as a replacement for the others.
For an individual farm, the relevant question is therefore specific: which observation connects this location, this period and this reported loss? A broad coloured area on a map is an invitation to seek that connection, not a complete farm assessment.
Source notes: 2. Original editorial examples and interpretations are identified separately.
A forecast supplies context, with its own limits
The CBEFS documentation describes simulations of environmental variables including temperature, salinity and dissolved oxygen, with present and short-term forecast views. VIMS’s separate bloom account describes its harmful-algal-bloom forecasts as experimental and informational, intended to complement sampling and other monitoring.
A reconstruction and a forecast should also retain their different labels. The former asks how conditions may have developed during a past period. The latter asks what the model expects next. Neither label means that a model output is a direct measurement of every condition inside an oyster cage.
A useful comparison would put the model period beside the dates of the available observations and explain where they agree or remain unresolved. We have not conducted that comparison. The practical reading rule is to look for the supporting observations and the stated uncertainty before turning a plausible environmental explanation into an established cause.
Source notes: 3, 2. Original editorial examples and interpretations are identified separately.
Check the image date and the missing view
Maryland’s separate Eyes on the Bay satellite service makes two operational limits explicit: cloud cover affects visibility over the bay, and processed data maps can arrive several days after an observation. The page links visual imagery and several derived water-quality products. Those are related views with different information behind them.
This is a useful independent check on how readers approach a satellite interface, rather than independent confirmation of the Virginia team’s individual findings. A blank or old-looking view needs an explanation of availability. It should not silently become evidence that a bloom was absent, and a later processing date should not be mistaken for the time the water was observed.
Keep the observation time, processing or publication time, geographical coverage and product description together. That small amount of context can determine whether two attractive maps are actually comparable. It also makes an honest gap in the evidence visible.
Source notes: 4. Original editorial examples and interpretations are identified separately.
The grower’s question includes timing
WHRO’s October 8 reporting independently documents growers confronting the September event. Its interview with oyster farmer Alex Lambert describes his request for earlier warning. We use that reporting to identify a practical stakeholder concern, without treating one account as a complete measure of regional damage or an independent validation of the satellite analysis.
Virginia Tech’s response page separately describes a collaborative effort to support affected shellfish producers and maintains resources as the response develops. That establishes an assistance effort; it does not establish that a particular map has already prevented a loss.
For this audience, a scientifically informative reconstruction and a timely operational warning answer different needs. A useful future evaluation would say when information became available, who received it and what decision it could support. Better interpretation after an event has value, but it should not be reported as a warning that growers demonstrably received beforehand.
Source notes: 5, 6. Original editorial examples and interpretations are identified separately.
Keep the assessment connected to a record
September 28 guidance on Virginia Tech’s response page explains why mortality requires its own assessment. The VIMS-authored method separates stock by size and farm area, uses randomly selected sampling units, records live and freshly dead oysters, and retains evidence of inventory before the event. We have not applied this method.
A satellite image cannot supply those counts. Conversely, a count from a sampled unit does not by itself explain conditions across a bay. Our proposed evidence record would connect each observation to its date, location, method and limitation, keeping a reported loss separate from a verified estimate. A later assessment could then add evidence without rewriting what was known earlier.
We have not interviewed growers, measured mortality, tested a forecasting service or assessed the safety of water or shellfish. This article makes no harvesting or food-safety determination. Its focus is the evidence needed to interpret the monitoring work and the limits of the reports we could verify.
Source notes: 6. Original editorial examples and interpretations are identified separately.
Our photograph provides geography, not a bloom result
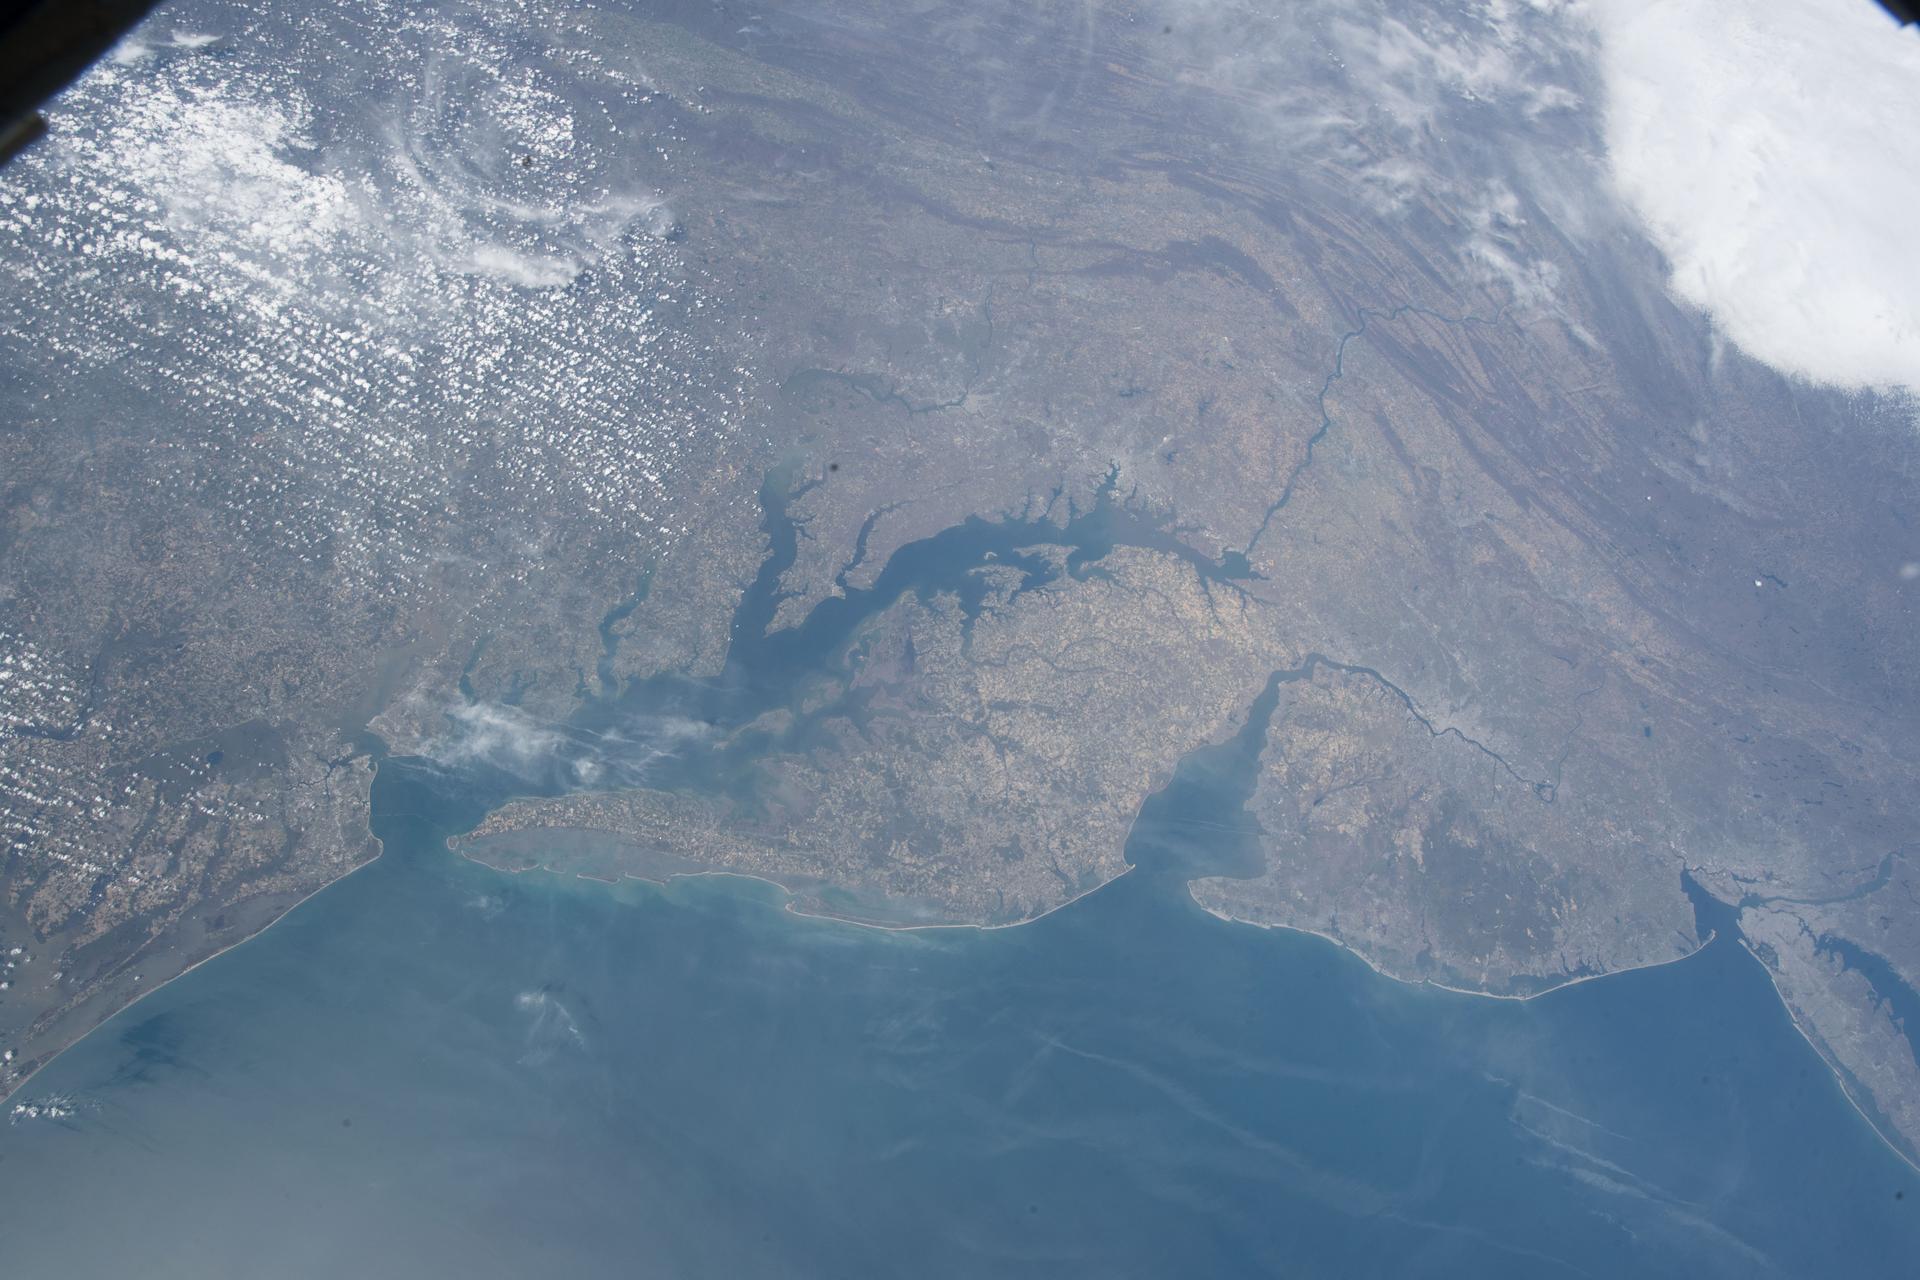
NASA’s image record dates this ISS photograph of Chesapeake Bay, Delaware Bay and the surrounding US east coast to April 14, 2018. It is archive geographical context, not September 2026 bloom imagery or a view identifying affected oyster farms.
That distinction also applies to the article’s central claim. The new assessment report describes a useful combination of tools. The meaningful next evidence is how those tools connect to dated observations and clearly bounded conclusions about the earlier event.
Source notes: 7. Original editorial examples and interpretations are identified separately.
Sources & Methods
Prepared October 30, 2026. The news hook is NASA’s October 29 account of an assessment of a September event. We read separate field-monitoring, model, satellite-interface and response-resource documentation, plus WHRO’s earlier independent reporting. Our evidence-record proposal is original editorial analysis and has not been implemented or tested. No water sampling, farm visit, interview, mortality measurement, forecast validation, harvesting advice or food-safety assessment performed. NASA has not reviewed or endorsed this article. The real NASA photograph is dated archive context; actual pixels inspected.
- NASA: satellite and forecast support for oyster-loss assessment — Primary assessment report; October 29, 2026; September event
- VIMS: field account of the Eastern Shore bloom — Primary monitoring account; September 22, 2026; earlier context, not a current advisory
- VIMS: Chesapeake Bay Environmental Forecast System — Primary model-product documentation; undated; read October 30, 2026
- Maryland DNR: satellite-map availability and processing limits — Separate primary operational documentation; undated; read October 30, 2026
- WHRO: oyster growers describe the September event — Independent reporting by Janet Bernosky; October 8, 2026; stakeholder context
- Virginia Tech: Northampton shellfish mortality response — Separate primary producer-response resources; read October 30, 2026
- NASA: ISS archive photograph iss055e023210 — Primary image record and API; capture April 14, 2018; NASA
- NASA: images and media guidelines — Primary reuse conditions; read October 30, 2026; factual editorial use and no endorsement