
A new publication does not make this a live view
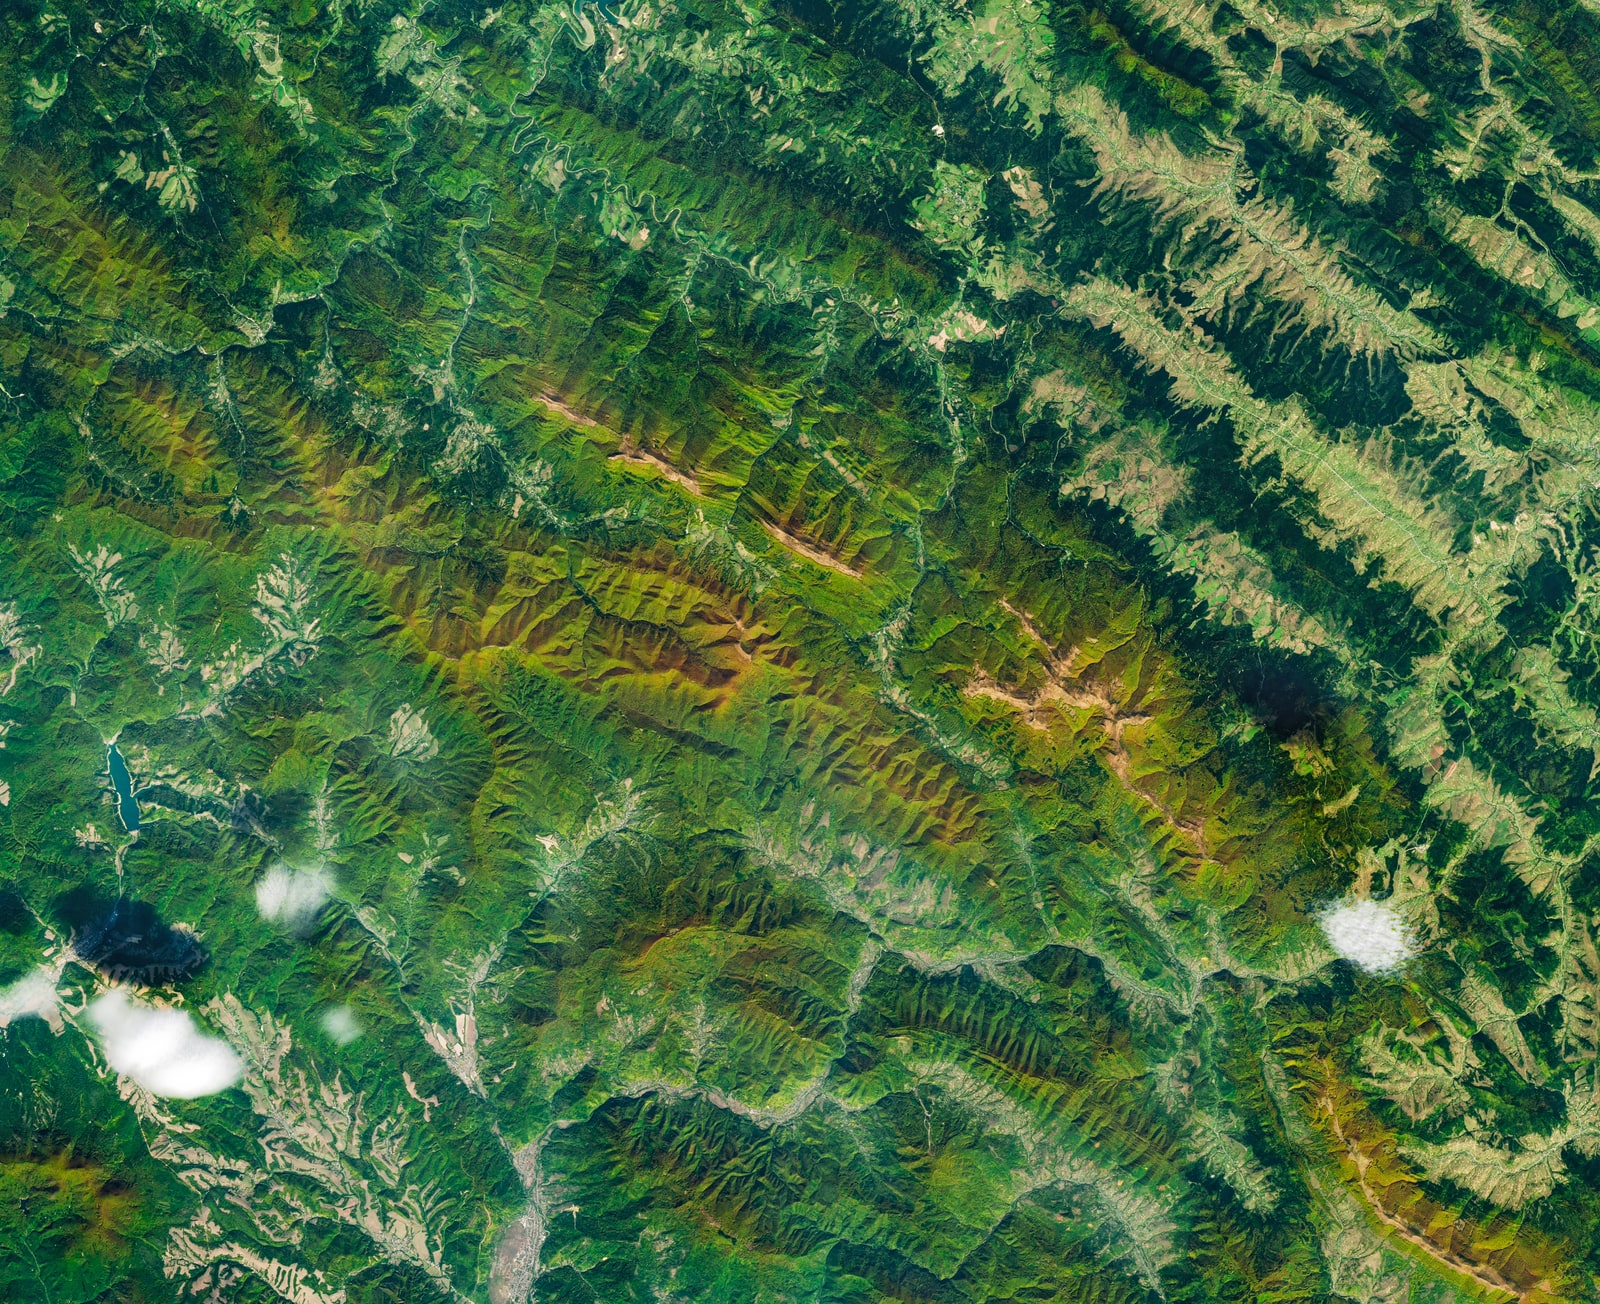
NASA’s October 19 image article shows Poland’s Bieszczady Mountains using an October 8 Landsat 9 observation, describing autumn forest colors and tan mountain meadows. Publication and acquisition are different dates.
That small distinction changes what the image can tell a reader. It is a view of a landscape at a documented moment, not a camera pointed at the mountains while this page loads. Nothing in our article establishes today’s leaf coverage, the visibility from a hiking trail or the conditions somebody would encounter there tomorrow.
There is a useful analogy for photographers: the date a picture enters a gallery is not necessarily the date the shutter opened. A new release can bring an older observation to public attention. Keeping those dates attached is part of using the picture accurately, particularly when the subject is a seasonal transformation.
Source notes: 1. Original editorial examples and interpretations are identified separately.
Real observations can be processed into different kinds of color view
NASA’s instrument description says OLI measures visible, near-infrared and shortwave-infrared light. Its color explainer distinguishes a display combining visible red, green and blue measurements from false-color combinations that incorporate other wavelengths or data. Processing observations into a picture is not the same as inventing a scene.
For this particular image, however, the accompanying article does not identify the precise band combination. We have not reconstructed it and do not assign an independently verified true-color or false-color label. The distinction below explains how such products work generally; it is not a claim about an unreported processing recipe.
Think of a display as an agreement between a measurement and a color channel. If that agreement changes, the appearance can change even when the underlying location does not. This is why deciding that a red area must be unhealthy, simply because it is red on a screen, would skip an essential part of the interpretation.
Source notes: 2, 3. Original editorial examples and interpretations are identified separately.
A pixel represents an area, not an individual tree
NASA gives OLI a 30-meter multispectral sampling scale and a separate 15-meter panchromatic scale. Those instrument specifications are not a measurement of how this particular published JPEG was resampled or prepared.
Here is an original geometric illustration using the first scale: a square 30 meters on each side has an area of 30 × 30 = 900 square meters. Three such squares cover 2,700 square meters. This is classroom arithmetic, not an estimate of the forest shown or a claim that we counted native pixels in the downloadable image.
Now imagine one of those squares straddling a boundary between trees and open ground. Its recorded signal need not belong exclusively to either side. Calling the entire square forest because it appears predominantly one color would be a classification decision. It would not be the same thing as directly seeing the identity and condition of every tree inside it.
Enlarging the displayed square does not remove that distinction. More screen pixels can make a picture easier to view without adding new observations of the ground. For a photographer accustomed to zooming into an image, this is the important limit: a larger view and finer measured detail are not interchangeable.
Source notes: 2. Original editorial examples and interpretations are identified separately.
Landscape appearance, tree cover and forest condition ask different questions
Consider three hypothetical requests about the same mountain slope. One reader wants an attractive autumn illustration. Another wants to estimate how much of a defined area is tree-covered. A third wants to know whether those trees are under stress. The requests share a location, but they do not share an acceptance test.
The illustration can succeed by presenting an accurately credited view with its date and context. A tree-cover estimate would need a definition of cover, a treatment of boundaries and a way to check classifications. A condition assessment would additionally need evidence connecting the selected measurements to the condition being assessed. We have performed neither assessment here.
These are distinctions in our explanatory framework, not claims that the NASA image is unsuitable for every further analysis. The underlying observations may support questions that a finished web picture cannot answer on its own. Readers should not confuse a limit of this article with a limit on all possible research using the data.
Our scientific perspective is that a useful image helps formulate a better question. It does not have to settle every question immediately. Recognizing the boundary between appearance and diagnosis makes it possible to appreciate the view while reserving stronger conclusions for a defined analysis.
Source notes: 1, 3. Original editorial examples and interpretations are identified separately.
The next image is useful when the comparison stays meaningful
Imagine a photographer choosing between two original, fictional captions: one says the slope looks different in two views; the other says a measured ecological change has occurred. The first describes an appearance. The second requires an account of what was measured and why the difference supports that interpretation.
For a proposed follow-up, we would identify the same area, retain the acquisition dates and document how each view was prepared. That would make it possible to ask whether a difference belongs to the observation, the presentation or the chosen comparison. This is a suggested exercise, not an analysis we performed or a promise that every difference can be resolved.
There is no contradiction in wanting both a compelling picture and careful measurement. They can be separate outputs from the same broader project. A photographer might prepare a visually readable image for a gallery while an analyst preserves the data and processing information needed for a narrower quantitative question.
What matters is carrying the distinction into the caption and conclusion. We would not turn a contrast between two attractive exports into a claim about a trend, a regional emergency or the ideal day for a trip. The stronger the conclusion, the more the comparison needs to explain.
Source notes: 2, 3. Original editorial examples and interpretations are identified separately.
What this view adds to the day’s science coverage
The value of this release is not a newly discovered forest or a diagnosis delivered from orbit. It is an accessible opportunity to connect an everyday experience—seeing autumn colors—with the less visible choices behind observing a landscape remotely. Our original contribution is the separation of dates, sampling area and intended interpretation.
The illustration reproduced here is the published observational image, not generated artwork or an ordinary camera photograph. Its creator credit and acquisition date remain attached. NASA’s Earth imagery policy permits reuse, including commercial use, where no separate copyright notice applies; none was identified for this image. Credit does not imply agency endorsement of our explanation.
We read the current image article and the cited technical explanations, not a new research paper establishing forest condition. Lumacta has not visited the location, interviewed its researchers, downloaded and processed the scientific scene products or independently verified the image’s band recipe. Those limits define this explanation rather than disappearing behind the image’s appeal.
Source notes: 1, 2, 3, 4. Original editorial examples and interpretations are identified separately.
Sources & Methods
Prepared October 19. The complete image article was read directly after its indexed version omitted middle paragraphs. NASA’s instrument page and complete false-color explanation provide technical context, not a new forest study. The pixel-area arithmetic and comparison framework are original teaching examples, not measurements. The reuse FAQ and image-specific credit were checked. No scene reconstruction, fieldwork, classification, ecological diagnosis or interview was performed.
- NASA: the October 19 image — Primary image article; complete main text, image credit and acquisition date read
- NASA: OLI instrument — Primary instrument reference; complete explanatory sections read, updated December 19, 2025
- NASA: how satellite colors work — Primary educational explanation; complete main text and captions read; not a processing recipe for the current image
- NASA: Earth imagery reuse — Primary reuse and citation guidance; complete FAQ main text read