
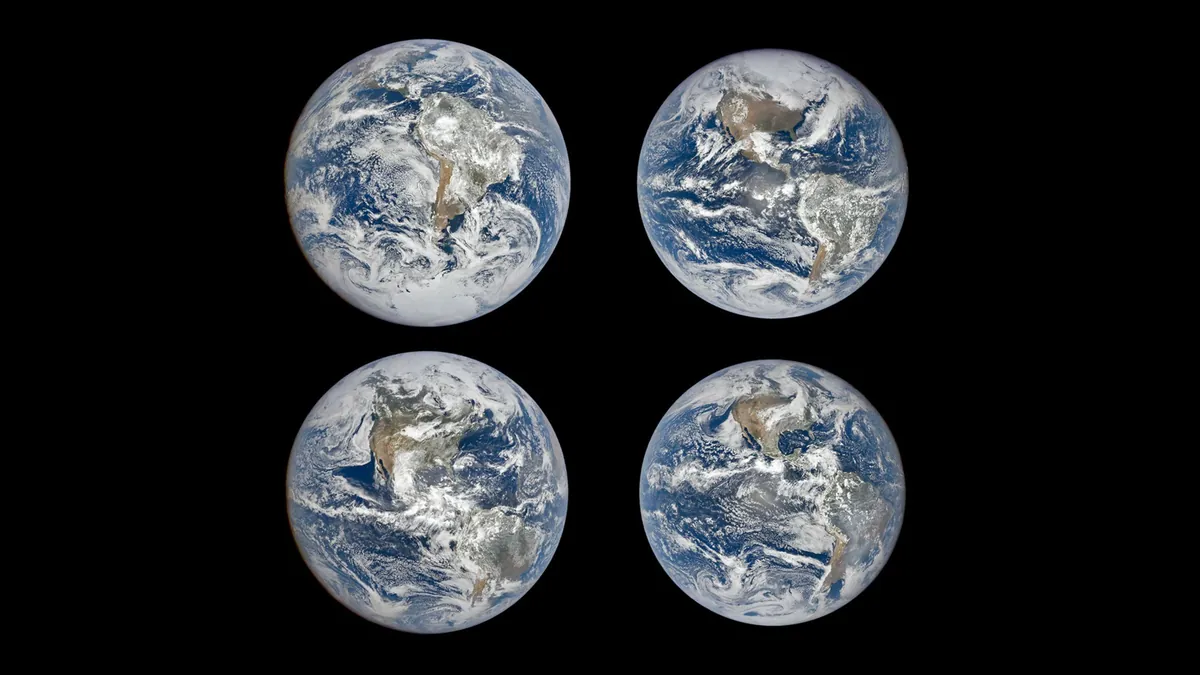
A timely release using clearly dated observations
NASA Earth Observatory published a four-image comparison on September 22, 2026 showing how Earth appears around solstices and equinoxes from the EPIC camera aboard DSCOVR. The release is new; the observations are not from today. They were captured on December 21, 2023, March 19, 2024, June 20, 2024 and September 22, 2024.
The September 2026 equinox occurred on September 23 at approximately 00:05 UTC, or 03:05 in Bucharest. The US Naval Observatory's linked table displays 01:05 for a selected UTC+1 offset; we converted that time to UTC and Romania's summer-time offset. Local calendar dates can differ across the world.
This is an explainer tied to that event, not a claim that a new satellite has launched or a new law of nature has been discovered. The appeal is more direct: familiar geography looks different when the viewing geometry changes, and a distant camera makes the reason unusually visible.
Sources: NASA Earth Observatory: An Epic View of the Seasons (September 22); US Naval Observatory: Earth's seasons for 2026 (UTC+1 table)
Why opposite hemispheres have opposite seasons
NASA's seasonal explanation centres on Earth's tilted rotation axis, about 23.5 degrees from the perpendicular to its orbital plane. As the planet travels around the Sun, the hemisphere leaning toward the Sun receives more direct sunlight and longer days. Six months later, the other hemisphere has the favourable orientation.
Distance from the Sun is not the explanation for this north-south reversal. NASA Space Place points out that Earth reaches its closest approach during January, when it is winter in the Northern Hemisphere. Both hemispheres share the same planet-to-Sun distance at any given moment, but they receive sunlight at different angles and for different lengths of time.
An equinox marks the transition when neither hemisphere has the seasonal tilt advantage toward the Sun. That astronomical event should not be read as a weather switch. A date on the calendar does not promise an immediate temperature change in a particular town, nor identical conditions north and south.
EPIC is a measuring instrument, not just a space webcam
NASA describes EPIC—the Earth Polychromatic Imaging Camera—as a ten-channel spectroradiometer aboard NOAA's DSCOVR spacecraft. Its telescope and detector observe the sunlit face of Earth in selected ultraviolet, visible and near-infrared bands. The instrument documentation connects those channels to measurements involving ozone, aerosols, clouds and vegetation.
The familiar colour view is therefore one presentation of a broader measurement system. NASA also describes corrections for differences in detector sensitivity and stray light before imagery or science products can be produced. Processing is part of making an observation usable; it does not mean the planet in the image was invented.
For a reader, this is a helpful change of perspective. Ask not only whether a picture looks sharp, but what quantities the instrument can actually constrain. A camera designed to see an entire hemisphere answers different questions from one intended to resolve individual buildings. More impressive-looking detail would not automatically make it better for its scientific purpose.
The same spacecraft also watches the solar wind
NOAA explains that DSCOVR operates near the Sun-Earth L1 region, roughly a million miles from Earth. This location lets its space-weather instruments sample the solar wind before that flow reaches our planet, supporting alerts and warnings. The mission combines that operational role with Earth-observation instruments.
The components should not be confused: EPIC's images of Earth are not themselves direct measurements of the incoming solar wind. Sharing a spacecraft does not make different sensors interchangeable. Their location creates several useful opportunities, but each instrument has its own measurement and purpose.
NASA's seasonal comparison also notes that changes in DSCOVR's distance and viewing angle affect the apparent size and illumination of Earth's disk. In other words, an image difference can come from the observer as well as the observed object. That is a valuable general lesson for satellite photography: geometry belongs in the explanation, not only in a technical footnote.
Sources: NOAA: DSCOVR mission and solar-wind monitoring; NASA Earth Observatory: An Epic View of the Seasons (September 22)
Scientific perspective: compare like with like
Lumacta's evidence-based assessment is that the four views work well as an explanation of seasonal geometry. They are not, on their own, an experiment measuring global warming, a local drought or a change in vegetation productivity. Different claims need different observations, controls and analysis.
A meaningful time comparison should account for when each image was taken, which area is visible, the observing angle and the relevant instrument processing. Clouds and illumination can alter appearances without the underlying surface changing in the way a casual reader imagines. These are reasons to inspect the measurement context, not reasons to dismiss satellite evidence.
For a classroom or newsroom, a useful exercise would be to write down what is directly visible before proposing a cause. Which continent is nearer the centre? Which polar area is in view? Then check the documented geometry. We propose that exercise as a reading method; we have not performed a new quantitative analysis of the EPIC archive for this article.
Sources: NASA Earth Observatory: An Epic View of the Seasons (September 22); NASA: EPIC instrument and calibration
The everyday value of seeing the whole planet
The technology is most interesting when the postcard view leads to better questions. A small collection of pictures can introduce the seasons. A calibrated sequence of observations can support research into how clouds, the atmosphere and the surface behave. Those are different levels of evidence, and readers benefit when reporting keeps them separate.
Publicly accessible mission explanations also make sophisticated observation technology less remote. Students can connect an instrument, an orbit and a physical effect without needing to mistake a rendering for a photograph or an archive image for a live feed. The dates and credit are part of that educational value.
The conclusion is modest but useful: the equinox is an opportunity to understand how we know what we know about Earth. The most valuable feature of a scientific image is not that it looks authoritative. It is that its origin, timing and interpretation can be checked—and that its limitations remain visible alongside its beauty.
Sources: NASA Earth Observatory: An Epic View of the Seasons (September 22); NASA: EPIC instrument and calibration; NOAA: DSCOVR mission and solar-wind monitoring
Sources & Methods
Checked September 23, 2026. NASA's new September 22 release uses observations from 2023–2024. Equinox timing was converted from the US Naval Observatory's explicitly selected UTC+1 table. NASA instrument and seasonal documentation plus NOAA mission information provide context. No new climate analysis, forecast or experiment was performed.
- NASA Earth Observatory: An Epic View of the Seasons (September 22) — Primary image release; archive observation dates
- US Naval Observatory: Earth's seasons for 2026 (UTC+1 table) — Official astronomical timing; offset converted in article
- NASA Space Place: What Causes the Seasons? — Official explanation of axial tilt and seasons
- NASA: EPIC instrument and calibration — Primary instrument documentation
- NOAA: DSCOVR mission and solar-wind monitoring — Primary spacecraft and mission documentation