
Newly published does not mean newly erupting
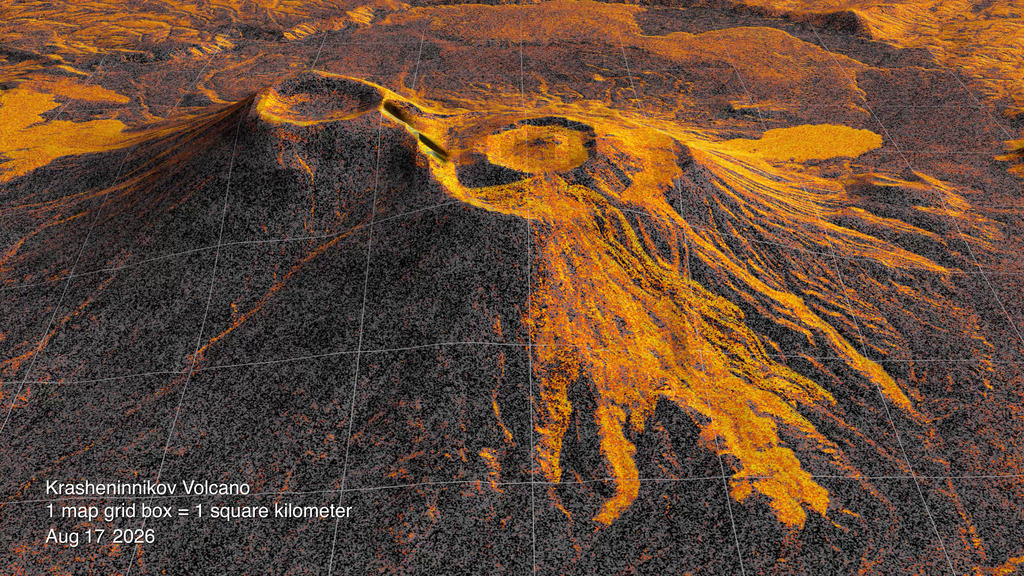
The September 24 release shows lava spreading from Krasheninnikov’s northern crater on Russia’s Kamchatka Peninsula. The eruption began in 2025; this is not a report of a new eruption today. The NASA-ISRO Synthetic Aperture Radar mission supplied a sequence of observations that researchers assembled into a time-lapse.
The Scientific Visualization Studio identifies 17 frames spanning December 25, 2025 to August 17, 2026. That chronology is central to reading the result. The publication date tells us when the visualisation became available, while the acquisition dates tell us what period it can actually describe.
Our interpretation is that the value lies in the record between the endpoints. One image can show a lava field. A carefully dated sequence can help establish how that field expanded, provided the reader does not mistake the speed of the animation for the speed of the real event.
Source notes: 1, 2. Analysis and proposed examples are identified in the text.
The bright lava field is not a thermal-camera view
NASA’s technical explanation describes radar imaging as the measurement of transmitted signals and their returning echoes. Synthetic aperture processing uses the instrument’s motion and the recorded signals to form a sharper image than the physical antenna alone would provide. Surface properties and viewing geometry influence the return.
In this sequence, lava stands out because of its radar reflectance relative to nearby ground or snow. The release describes each pixel as representing roughly a 10-by-10-metre patch. A brighter patch here should not be read as a temperature measurement, and the pixel spacing is not a promise that every object of that size can be identified.
That distinction matters to a general reader: an image can be physically measured and still need interpretation. Asking “what quantity does the instrument record?” is more useful than assuming every satellite picture behaves like a photograph taken through a long lens.
Source notes: 1, 3. Analysis and proposed examples are identified in the text.
A repeat orbit does not turn the sequence into continuous video
The mission material describes two viewing directions within a 12-day repeat cycle. The published animation uses selected acquisitions, and its source record lists gaps of different lengths between frames. It should not be described as an evenly sampled, uninterrupted movie of the eruption.
A simple reading exercise illustrates the consequence. If two adjacent frames represent dates far apart, a large change between them does not show exactly when that change occurred. If two dates are close together, a smaller change may still represent rapid activity. The viewer needs the dates before comparing apparent speed.
For a quantitative follow-up, Lumacta would want an explicitly defined measurement of the lava field, consistent processing and uncertainty estimates attached to each date. We have not downloaded or reprocessed the radar data, measured an area or calculated a flow rate. The visual sequence is the evidence discussed here.
Source notes: 2, 4. Analysis and proposed examples are identified in the text.
Observation and forecasting answer different questions
Scientific perspective: documenting where the surface has changed is not the same achievement as predicting when a volcano will erupt. A forecast needs a defined outcome, a time horizon and a way to count both missed events and false alarms. A striking retrospective sequence does not supply those tests on its own.
This also limits causal claims. An earthquake preceding an eruption can motivate investigation, but temporal order alone does not establish the mechanism. Our account does not turn the release’s suggested connection into a demonstrated cause.
For an emergency-response application, the next question is how quickly usable observations reach the people making decisions, how uncertainty is communicated and what happens between satellite passes. Those are additional system requirements, not reasons to dismiss the satellite. A measurement can be valuable without being a stand-alone warning service.
Source notes: 1, 2, 3. Analysis and proposed examples are identified in the text.
Open data makes the result inspectable, not automatically simple
The NISAR mission overview lists L-band and S-band radar instruments and identifies the Alaska Satellite Facility as the public archive for the mission’s NASA radar data. It describes the July 20 provisional L-band release as calibrated, with validation at a limited number of sites. That qualification belongs beside the promise of broad coverage.
For a reader who wants to go beyond the animation, start with the source record and acquisition list, then the mission’s radar guide. A researcher would also need the correct product type and processing documentation before making a new measurement. Open access removes an access barrier; it does not remove the need for specialist interpretation.
A useful independent replication would make its processing choices visible and explain what changes if a different threshold or geometry is used. That is our proposed standard for a follow-up, not a replication performed for this article.
Source notes: 4, 5. Analysis and proposed examples are identified in the text.
The lasting contribution is a repeatable record
Lumacta’s assessment is that this release is interesting for the same reason a well-kept laboratory notebook is interesting: it allows a change to be traced through time. The resulting animation is accessible, but the dates and measurement method do the scientific work.
Read it as evidence of an evolving landscape, not a heat map, live broadcast or prediction of the next eruption. That narrower interpretation is still consequential. Better records give researchers a firmer basis for asking what happened and, eventually, for testing explanations that can survive comparison with the data.
Source notes: 1, 2, 4. Analysis and proposed examples are identified in the text.
Sources & Methods
Checked September 25, 2026 against NASA/JPL’s September 24 release, the SVS visualisation record and mission documentation. Acquisition dates are distinguished from publication. The scientific perspective is Lumacta analysis, not an interview or a new peer-reviewed result. No radar reprocessing, flow-rate calculation or eruption forecast was performed; NASA has not reviewed or endorsed this article.
- NASA/JPL: the Krasheninnikov time-lapse release (September 24) — Primary mission release; the observations are older than publication
- NASA SVS: visualisation 5675 and acquisition list — Original visualisation, credits and 17 observation dates
- NASA: how synthetic aperture radar works — Measurement method and interpretation limits
- NASA: NISAR mission overview and data status — Instrument wavelengths, public archive and provisional-data qualification
- NASA Earthdata: Alaska Satellite Facility DAAC — Public radar-data archive; no independent data analysis claimed