
Today’s NASA explanation reports research published in September
NASA’s October 20 account explains research published online in PNAS on September 14, with its issue dated September 22. The study examines April 2002–November 2025 water-storage trends and identifies 40 regions associated with human activities.
The important advance is not that a satellite suddenly photographed water hidden underground. It is a different treatment of measurements, aimed at separating spatial patterns that a broader representation can blur. Our explanation follows what that change makes easier to see—and what it cannot supply by itself.
Keeping the dates straight matters. This is a new public explanation of a published study, not a report that these regional changes occurred today. It is also not a live warning about the water available at a particular farm, reservoir or tap. Those questions require their own evidence and timescale.
Source notes: 1, 2. Original editorial examples and interpretations are identified separately.
Gravity measures a changing mass picture, not the contents of a glass
GRACE and GRACE-FO infer changing mass distributions from variations in satellite separation. The journal defines terrestrial water storage as water in the ground and at the land surface; it is not synonymous with groundwater alone. NASA’s mission overview identifies GRACE-FO as the successor tracking Earth’s water movement.
A useful way to read the result is to distinguish the measured signal from the interpretation attached to it. The spacecraft do not label a parcel of water as belonging to an irrigated field or a reservoir operator. Researchers connect the gravity-derived pattern with other information to investigate what may explain it.
That also distinguishes quantity from suitability. A change in stored mass does not establish whether water is easy to reach, affordable to pump or appropriate to drink. Our point is not a newly identified defect in gravimetry. It is that different practical questions require different measurements.
For an observer used to camera imagery, this is a change of perspective: a sharper mass-trend map is not a more detailed photograph of a well. Treating it as one would replace the actual measurement with a more familiar—but misleading—mental picture.
Source notes: 1, 2, 3. Original editorial examples and interpretations are identified separately.
A sharper long-term map does not become a faster monitoring service
The authors combine years of ranging observations to refine a long-term trend estimate, sacrificing the recovery of temporal dynamics. Their reported five-to-tenfold spatial improvement refers to area, not an equivalent multiplication of linear resolving power. They suggest pairing the result with conventional monthly products to recover more temporal context.
Here is an original illustration, not a reconstruction of their method. Two fictional stores begin at 100 units and end at 70. One loses ten units at each of three intervals; the other remains at 100, falls to 70 and stays there. The endpoints agree, but the timing stories differ.
That example does not claim that the two histories produce identical fitted regression slopes. It demonstrates only that a net change cannot stand in for a complete history. The paper’s specific regression method and uncertainty analysis are separate from this deliberately simple arithmetic.
Our interpretation is that this is a useful information bargain rather than an all-purpose upgrade. Finding where a sustained change is concentrated and tracking the response to a recent event are different tasks. A product optimized for the first should not silently be promoted into a service for the second.
Source notes: 2. Original editorial examples and interpretations are identified separately.
The same storage loss can conceal different flows
Consider another invented balance, using arbitrary units over one period. If 25 units enter a store and 35 leave, the change is minus ten. If ten enter and 20 leave, the change is also minus ten. Equal changes do not establish equal inflows or equal withdrawals.
This is ordinary accounting, not a regional estimate, a pumping model or an explanation of every process in the study. It shows why the amount stored and the amounts moving through a system should not be used interchangeably. A storage change is a result to explain, not automatically a counter for one particular activity.
Choosing a boundary adds another distinction. A transfer could increase a receiving store while reducing a supplying one. Looking only at the receiving area would answer a narrower question than asking about the connected system. The larger system cannot be evaluated by relabeling the local increase as an unconditional improvement.
For readers, this is why more stored water is not, by itself, a complete environmental verdict. Its location, source and consequences elsewhere remain relevant. We have not calculated those consequences for any of the regions in the paper and do not offer a management recommendation for a particular basin.
Source notes: 2. Original editorial examples and interpretations are identified separately.
A statistical association is a structured argument, not a single-cause label
The paper combines spatial modeling, local associations and literature assessment. Its authors acknowledge that local and nonlocal influences can be difficult to separate. Nearby observations are not automatically independent evidence, and the analysis explicitly addresses spatial dependence.
Our scientific reading is that a map gains explanatory value when it is accompanied by an account of how competing explanations were considered. A colored region beside an irrigated area can raise a useful question; the visual coincidence alone does not perform that investigation.
The same caution applies in the opposite direction. An area not highlighted by this analysis should not be treated as proof that people have no effect there. A method has a detection scale, a set of inputs and uncertainties. Its silence about a particular location is not equivalent to a field inspection finding nothing wrong.
The original lesson we take from this study is therefore about evidence assembly: preserve the measurement, the spatial relationship and the proposed explanation as distinguishable steps. Doing so makes it easier to understand both a strong result and the additional information that a contested local case might need.
Source notes: 2. Original editorial examples and interpretations are identified separately.
What the result changes—and what this article has not done
A smoother representation can hide the intensity or location of a sustained change. Recovering more of that structure can improve the question researchers ask next. It does not eliminate the need for temporal context, local information or a clear definition of the water quantity being discussed.
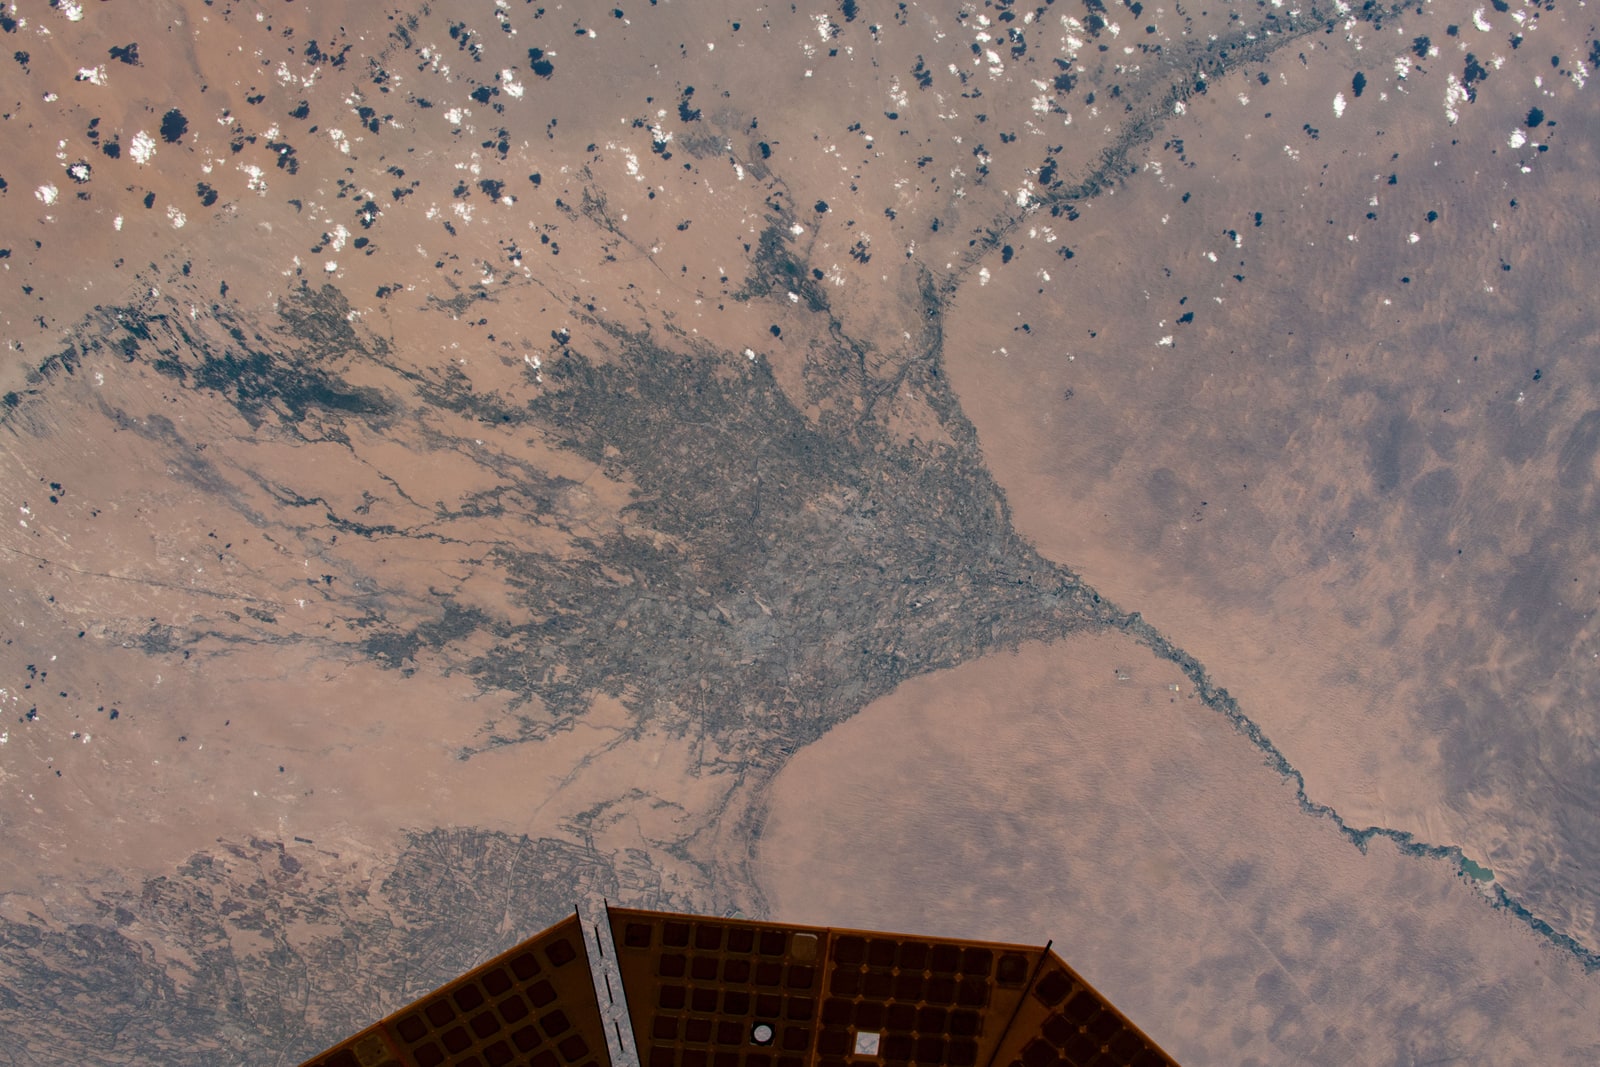
Our accompanying image is a genuine astronaut photograph of Turkmenistan from June 2021, used as geographical context. It is not the gravity-trend map, a photograph of groundwater or evidence of the study’s regional findings. The capture date and NASA image identifier remain attached.
We read the journal article through its methods and figure captions, not its separate supplementary appendix or dataset. No gravity processing, field visit, researcher interview, replication or current water-safety assessment was performed for this explanation. Our balance examples and scientific perspective are original editorial teaching, not additional observations.
Source notes: 1, 2, 4. Original editorial examples and interpretations are identified separately.
Sources & Methods
Prepared October 20. The complete NASA report and PNAS main article, including methods and figure captions, were read; PMC access varied, but a normal direct HTTP response provided the complete main text. The supplementary appendix and dataset were not analyzed. Publication dates were cross-checked against PubMed: online September 14, issue September 22. Original balance examples are not measurements or reconstructions of the study. The NASA/JSC photograph record and reuse conditions were checked; no camera or focal-length claim is repeated where source metadata conflict.
- NASA: October 20 account — Primary institutional account; complete article and image context read
- O’Neill, Rodell and Loomis: PNAS study — Primary journal article via PMC; complete main text, methods and figure captions read; not separate supplementary files
- NASA: GRACE-FO mission — Primary mission overview; complete main content read
- NASA/JSC: photograph record — Primary image record; date, attribution, dimensions and variants read