
Funding extends the work; it does not certify a product
The University of Washington announced October 5 that NSF IMOD, its optoelectronics research center, has received a second funding round. UW says NSF is expected to provide $22 million over five years. The center brings together 14 academic institutions. This is a research-investment announcement, not the launch of a new processor.
NSF describes its Science and Technology Centers as sustained, interdisciplinary research and education partnerships. That helps explain the institutional model. It does not independently confirm the renewal’s payment schedule, and we have not inspected the award agreement. The funding amount above remains attributed to UW.
For a reader wondering what this investment might change, our useful question is narrower than “Will light replace electronics?” Ask which manufacturing obstacle a project removes, what device then becomes possible, and how the researchers would demonstrate that it works repeatedly. Those are different steps with different measurements.
Source notes: 1, 3. Editorial interpretation and illustrative calculations are identified separately.
The manufacturing evidence is earlier than this week’s announcement
A 2024 paper reports electric-field-guided inkjet deposition of quantum dots onto suspended silicon-nitride optical cavities. Material reached one cavity in pairs separated by 100 nanometers. Published online March 30, 2024, it is earlier evidence, not this week’s discovery.
Our engineering reading is that placing an active material where a device needs it is itself a meaningful task. A material that performs well in a container is not automatically easy to integrate into a tiny structure. The structure, the deposition process and the resulting optical behavior must be considered together.
Think of the distinction as addressing an envelope versus delivering its contents in usable condition. Finding the right location solves an important problem. It does not establish that every intended function survives the journey. That analogy explains our assessment; it is not a result measured in the paper.
Source notes: 2. Editorial interpretation and illustrative calculations are identified separately.
A small separation is not a count of individual particles
The deposits are particle aggregates. The 100-nanometer figure is cavity separation, not proof of exactly one particle per target; reliable single-dot placement remains further work. This experiment is not a demonstrated array of individually printed single-photon sources.
Our proposed specification would list location accuracy and particle occupancy separately. A deposit can land inside its target while containing too many particles for an intended function. Conversely, a deposit could contain the right number while landing outside the region where it would interact usefully with the surrounding device.
For a process comparison, show the distribution of both quantities across all attempted sites, including empty and unsuccessful ones. A selected close-up can demonstrate that something happened. It cannot supply the denominator needed to establish how frequently the process succeeds.
Source notes: 2. Editorial interpretation and illustrative calculations are identified separately.
A fluorescent photograph is not an operating circuit
The study examines dot–cavity interaction through microscopy, spectra and emission lifetimes. Evidence for cavity-coupled emission is a different claim from demonstrating a computing task, a communication link or a consumer device.
Our proposed device review starts by defining which output matters. Is the requirement a particular wavelength, a stable intensity, a prescribed timing pattern or something else? Then measure that output under the intended input and environment. Success should follow a written requirement, not the attractiveness of a photograph.
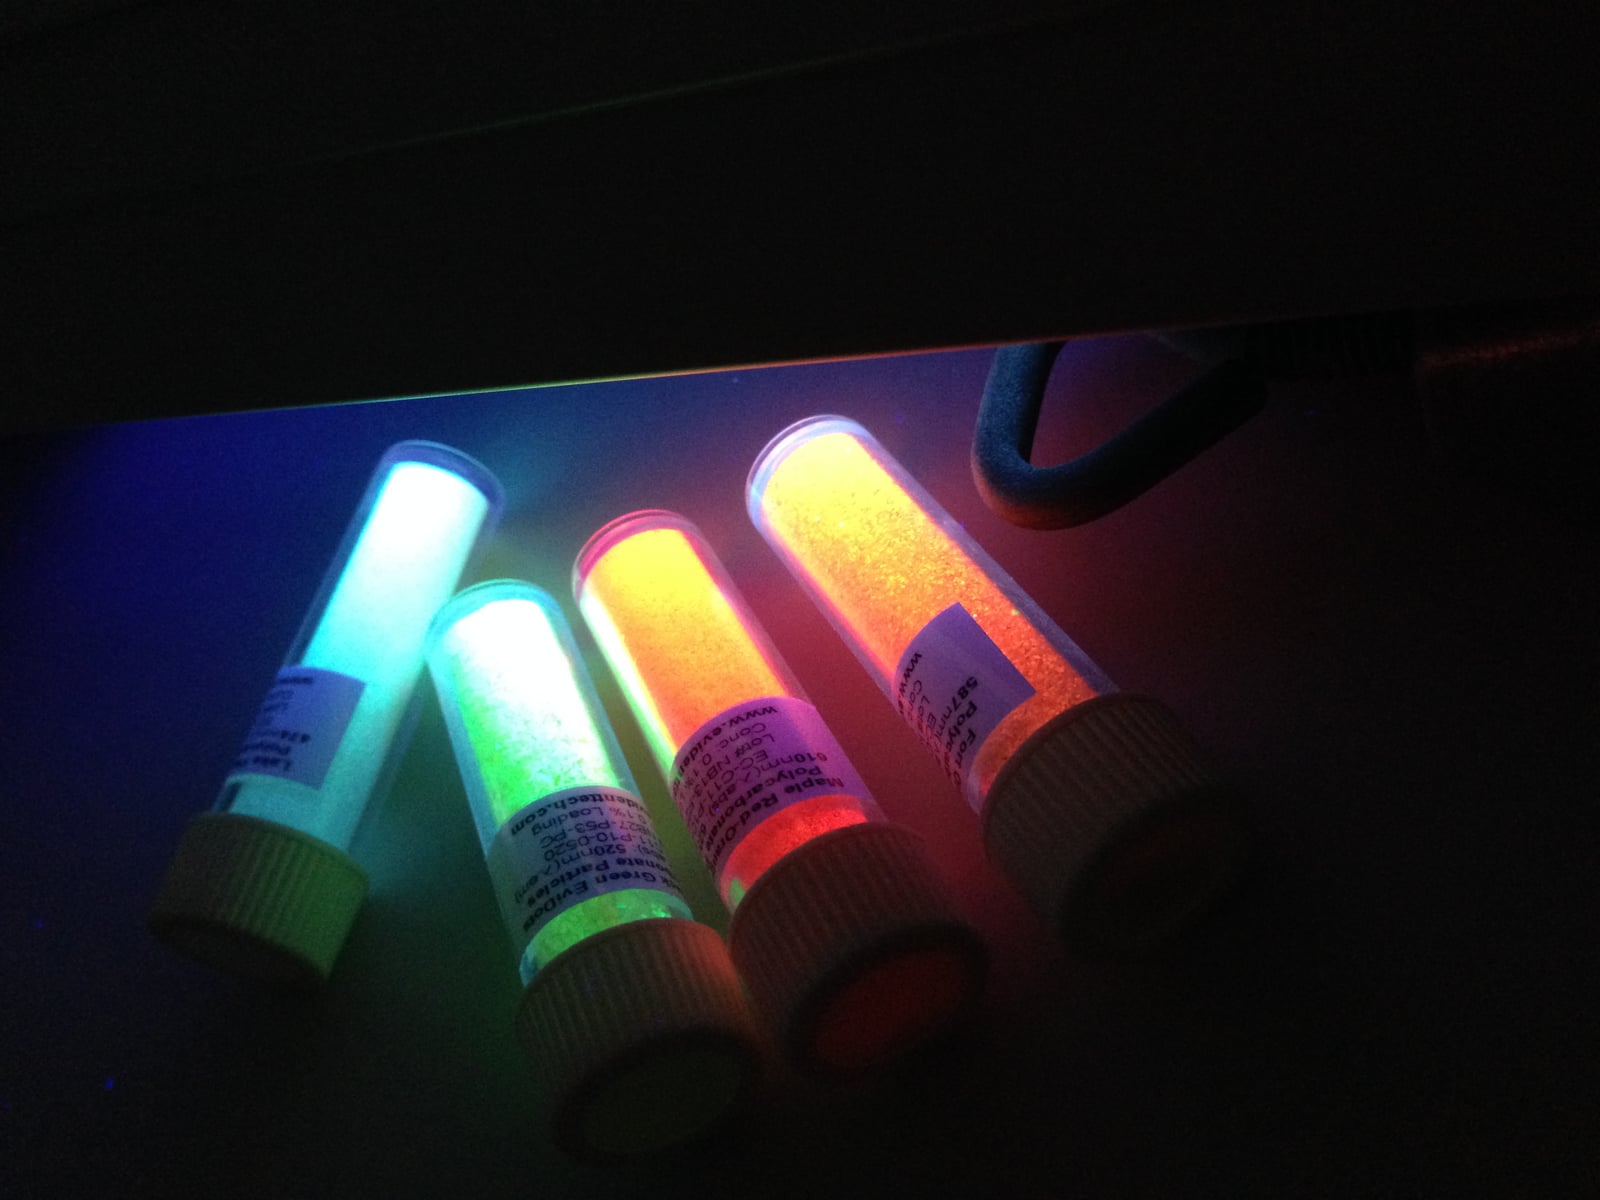
The archive photograph accompanying this article shows fluorescence for material context. It is not the UW apparatus or a measurement from the cited study. Keeping that distinction visible prevents a real, striking image from becoming evidence for a result it never recorded.
Source notes: 2. Editorial interpretation and illustrative calculations are identified separately.
Many useful elements make repeatability a system question
Consider an invented example, not IMOD data. Suppose each of 100 required elements independently has a 99% chance of meeting specification, and the complete assembly needs every one to pass. Its chance of passing is 0.99 raised to the power of 100: approximately 36.6%. High individual success can still leave many complete assemblies unusable.
At an assumed 99.9% individual success, the same calculation gives approximately 90.5%. Real failures may be correlated, and designs may permit spare elements or repairs, so this simplified calculation is not a production forecast. It shows why an individual-device demonstration and assembly yield answer different questions.
Our proposed comparison would report attempted sites, acceptable devices and acceptable assemblies, alongside the time and material spent on alignment, inspection and rework. Those denominators let readers distinguish a precise process from a dependable and economical manufacturing workflow.
Source notes: 2. Editorial interpretation and illustrative calculations are identified separately.
Judge the next phase by a task, not a funding headline
Our proposed milestone is a reproducible fabrication recipe paired with an optical acceptance test. Try multiple batches, retain failures and record whether the recipe transfers between operators or tools. Follow the same devices through operation rather than reporting placement and performance on unrelated best examples.
The investment creates room to investigate that path; it does not settle its outcome. Lumacta performed no fabrication, independent optical test or laboratory visit. The useful story is the distance between a promising integration method and an assembly that consistently does its intended job—and the measurements that would make that distance visible.
Source notes: 1, 2, 3. Editorial interpretation and illustrative calculations are identified separately.
Sources & Methods
Prepared October 6, 2026. We read UW’s October 5 announcement, the accessible main-text PDF of the 2024 printing study including its results, discussion, conclusion and experimental methods, and NSF’s Science and Technology Centers overview. The funding amount is attributed to UW; no renewal agreement was inspected. The paper predates the announcement and is not represented as a new 2026 experiment. Supporting information and underlying data were not independently reviewed. The placement/occupancy distinction, proposed acceptance tests and explicitly hypothetical independent-yield calculations are original analysis, not measured IMOD results. No fabrication, benchmark, interview or site visit was performed.
- UW: optoelectronic center receives a second NSF funding round — Primary institutional announcement, October 5, 2026. Expected funding amount is UW’s statement, not an inspected award agreement
- Guymon and colleagues: printing quantum dots on suspended nanophotonic cavities — Primary paper, DOI 10.1002/admt.202301921. Online March 30, 2024. Main text and methods read; supplements and raw data not reviewed
- NSF: Science and Technology Centers — Integrative Partnerships — Primary agency program description and active-center list. Context for interdisciplinary support, not independent confirmation of the 2026 renewal amount