
A new publication is not a live observation
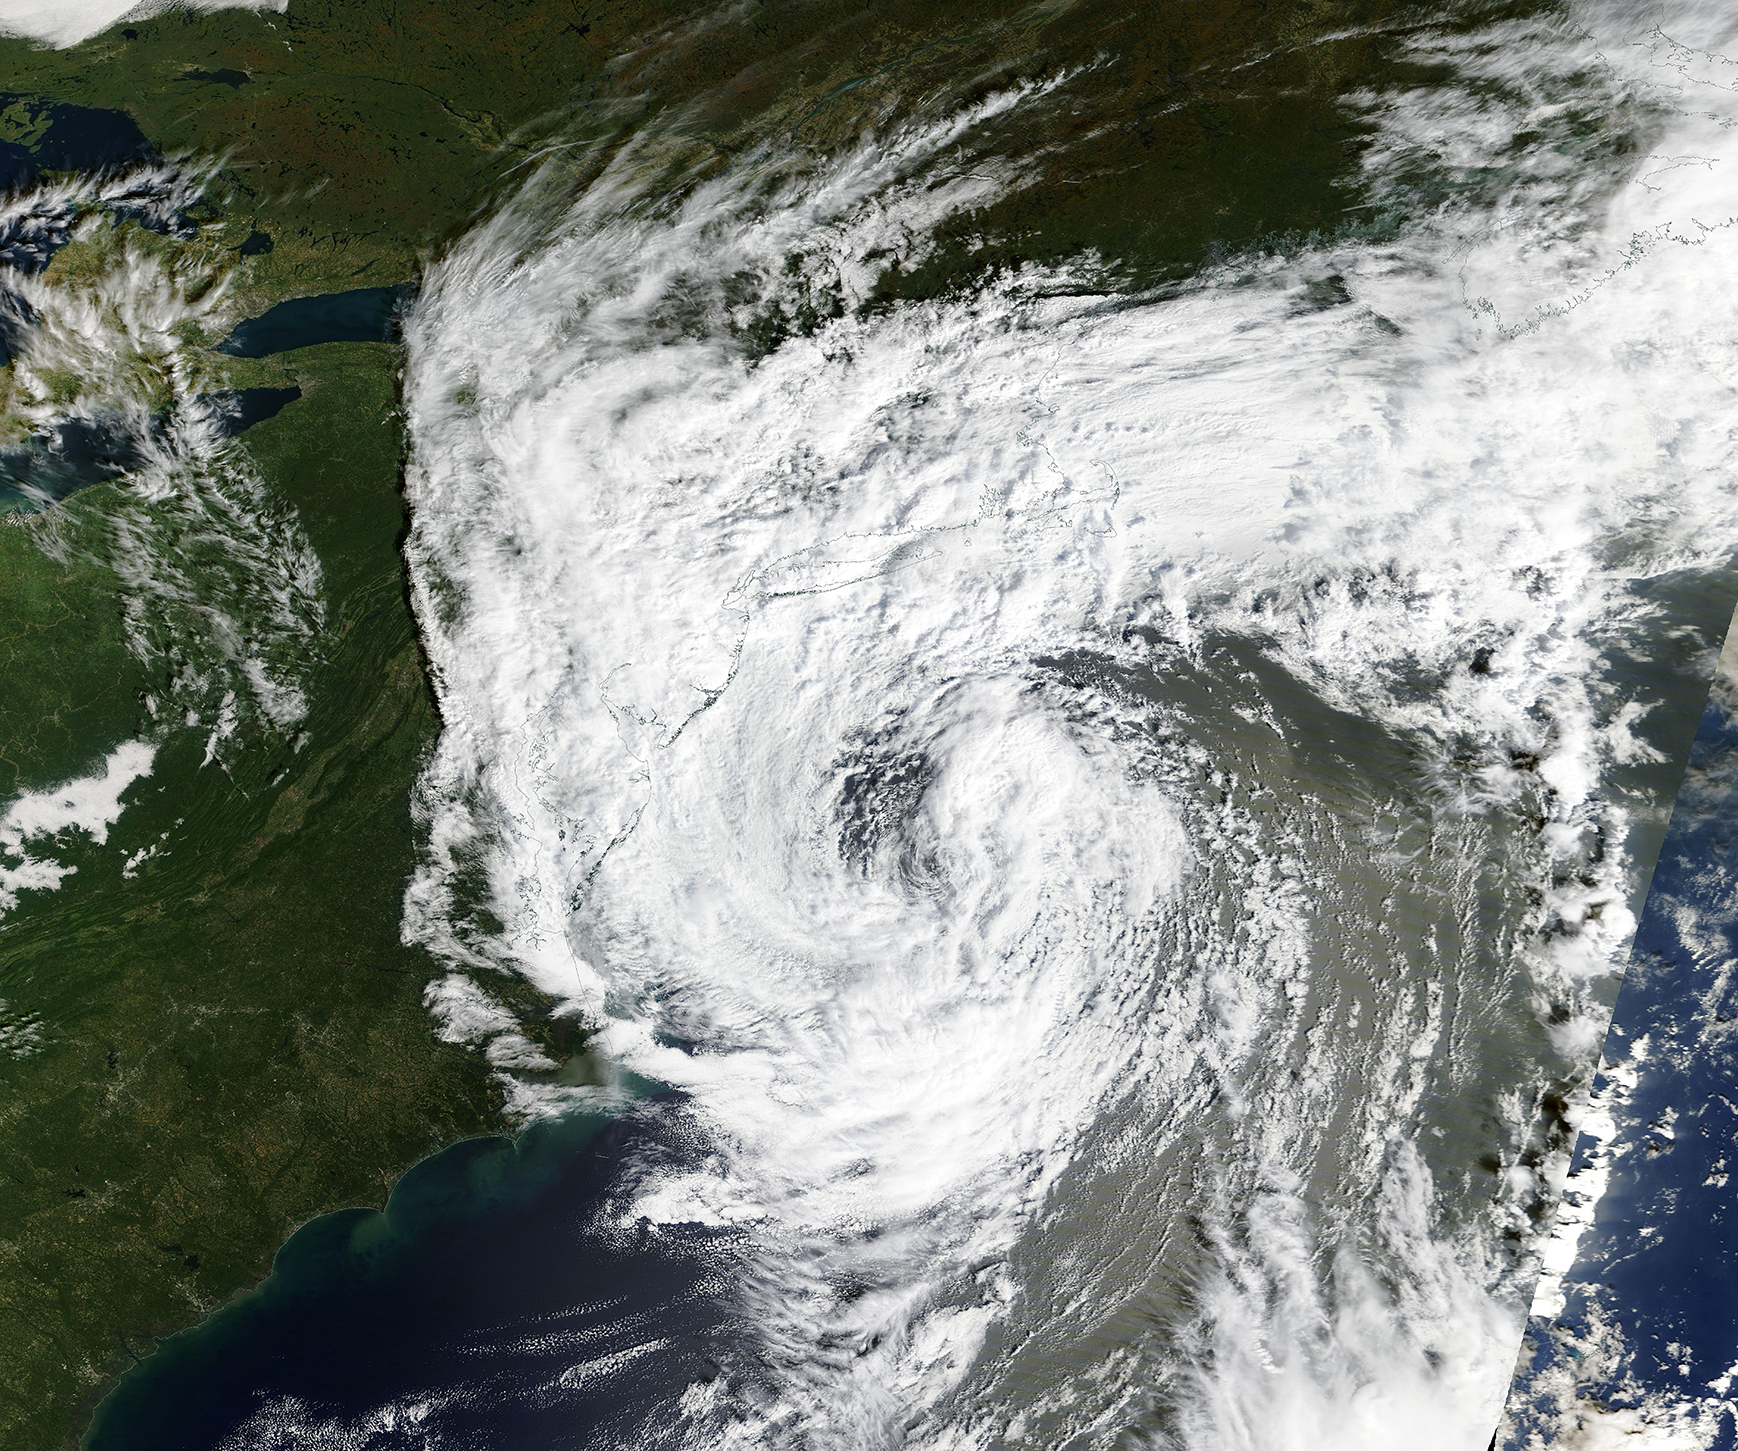
NASA’s MODIS Image of the Day for September 30 shows a broad cloud system off the United States’ East Coast. Terra captured the true-colour observation on September 26. NASA’s accompanying account describes a nor’easter affecting the coast during September 23–29, with flooding, erosion and disruption.
The acquisition date is the first detail a reader should retain. This is a newly published view of an earlier event, not a live picture of conditions on September 30. Sharing it without that distinction would make a useful observation misleading, particularly when someone is trying to understand current conditions.
Our focus is the observation technology and the evidence in the image. Lumacta has not surveyed the affected coast or independently verified the reported damage. The broad view helps connect places within a weather system; it does not replace local measurements or an up-to-date forecast.
Source notes: 1. Analysis and hypothetical examples are identified in the text.
The name describes a coastal storm pattern, not a snow requirement
NOAA defines a nor’easter as a storm along North America’s East Coast whose coastal winds are typically from the northeast. Such storms can occur at any time of year, although they are more frequent from September through April. The term is not limited to a snowstorm.
That definition helps explain the event label without treating a cloud shape as a diagnostic test. NASA’s feature identifies this event as a nor’easter; the photograph alone does not supply a complete pressure analysis, every wind observation or a classification of all the conditions it produced.
For current hazards, a dated gallery image is the wrong decision tool. Consult current local weather-service information instead. The scientific image is valuable for understanding what was observed and when, while warnings and forecasts address a different, operational question.
Source notes: 3. Analysis and hypothetical examples are identified in the text.
Natural-looking colour still comes from an instrument pipeline
NASA identifies the picture as a true-colour combination of MODIS bands 1, 4 and 3. The instrument’s specification places those bands in red, green and blue wavelength ranges. Combining their measurements produces a natural-looking view; it is not an AI-generated illustration of a storm.
The distinction is that a real observation can still be processed. The view represents selected measurements assembled into a display, rather than an unmediated window through which every property is visible. Processing does not make it fictional, but the choices need to remain part of its provenance.
Lumacta’s reading is to identify the subject before interpreting brightness. White cloud structures describe what the selected visible channels record. They do not directly label wind speed, rainfall totals or the depth of water on a particular road. Those quantities need suitable observations and analysis, not an attractive colour alone.
Source notes: 1, 2. Analysis and hypothetical examples are identified in the text.
A sharper download cannot create a new measurement
MODIS has 36 spectral bands. NASA lists native resolution of 250 metres for bands 1–2, 500 metres for bands 3–7 and one kilometre for bands 8–36. Because this composite uses bands 1, 4 and 3, its colour channels do not all start at the same spatial resolution.
This matters when choosing a download or zooming into a viewer. A display can resample channels onto a common grid, but a smaller output pixel does not create independently measured detail in a channel that began at a coarser resolution. Export dimensions and observing capability are not interchangeable specifications.
Our practical recommendation for developers using satellite imagery is to preserve the acquisition date, instrument, band combination and processing description beside the file. Otherwise a resized image can circulate with an impressive pixel count and no reliable explanation of what those pixels originally measured.
Source notes: 2. Analysis and hypothetical examples are identified in the text.
The coast needs more evidence than the cloud system
NASA’s account reports disruptive coastal effects. The image provides spatial context for that account, but Lumacta would not infer a damage total from it. A broad cloud field is not a survey of flooded buildings, closed roads or shoreline loss.
A useful investigation would combine a time series of observations with ground reports and appropriate measurements. The aim would be to connect an observed weather system to changes at specified places and times. A single frame can be part of that chain without being asked to establish the whole explanation.
The same restraint applies to intensity. A visually dramatic spiral should not be converted into a severity ranking without the relevant meteorological evidence. Comparing how two published pictures look is especially risky when their acquisition times, channels or processing differ.
Source notes: 1, 3. Analysis and hypothetical examples are identified in the text.
A striking picture is an observation—not climate attribution
Our scientific perspective is that this image answers a bounded question well: what did the selected satellite channels observe over this area at this time? It is much less informative about a long-term trend. One storm picture cannot demonstrate how often comparable events occur or why their frequency might be changing.
A climate-attribution claim would need a defined event measure, comparable records and an explicit method for comparing possible causes. None of that analysis is supplied by this visible image alone. Recognising the limit does not dismiss the storm; it prevents the observation from being used to support an unrelated conclusion.
The interesting technology story is therefore not just the size of the cloud pattern. It is how an instrument turns incoming light into evidence that people can inspect—and how much stronger that evidence becomes when its date, resolution and purpose travel with the picture.
Source notes: 1, 2, 3. Analysis and hypothetical examples are identified in the text.
Sources & Methods
Prepared September 30, 2026. We read NASA’s feature published today, the MODIS instrument specifications and NOAA’s nor’easter guidance. The photograph is the NASA-provided satellite observation, not generated artwork. Our interpretation distinguishes acquisition from publication, image sampling from native band resolution, and observation from attribution. We did not analyse raw sensor data, independently survey impacts or perform a climate-attribution study.
- NASA MODIS: September 30 Image of the Day — Primary feature; Terra observation acquired September 26, 2026
- NASA MODIS specifications — Instrument band and native spatial-resolution reference
- NOAA National Weather Service: nor’easters — Primary definition and general safety context; not a damage assessment of this event