
An October photograph, a September test
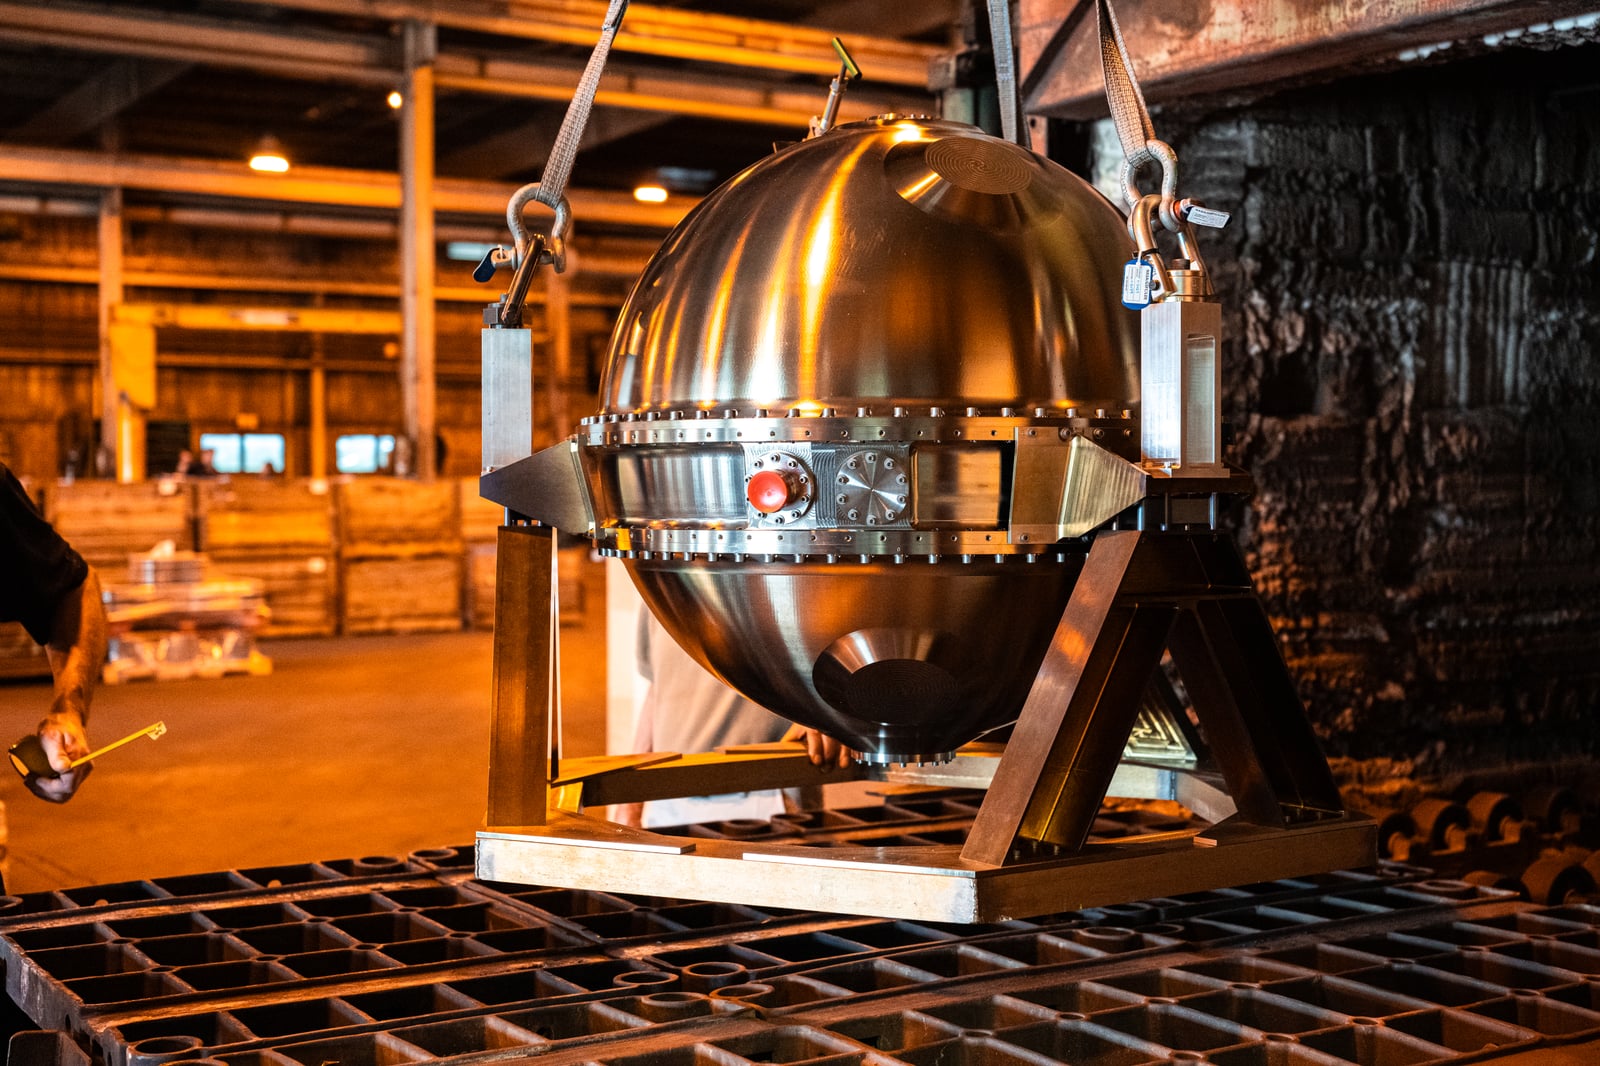
NASA’s October 2, 2026 image article shows DAVINCI’s engineering development unit before a thermal evaluation. The test ran August 28–September 10; the fuller account appeared September 24. October 2 is the photo report’s publication date, not a new test date.
The September account reports six heating cycles reaching 465°C on an approximately hour-long descent timeline. More than 100 sensors monitored hardware representing the instruments. That is a useful development result, with a specific scope: an engineering model exposed to a controlled heating sequence. It does not by itself demonstrate a complete mission.
Source notes: 1, 2. Editorial interpretation and illustrative calculations are identified separately.
The instrument has its own temperature story
DAVINCI’s planned probe will sample atmospheric chemistry, temperature, pressure and winds, then image terrain below Venus’s clouds. Those measurements explain why protecting the interior matters: delivering useful data requires more than a shell that retains its shape.
Our engineering reading separates the environment outside, the temperature of the shell and the temperature of each instrument. A surrounding chamber can become very hot while an insulated interior warms more slowly. That delay is valuable when the job lasts a finite time. It is not a promise that the inside remains cool indefinitely.
Think of insulation as restricting a flow of energy. It does not erase the temperature difference driving that flow. The design question is whether each component stays within its operating limits throughout the required measurement window, including any warming caused by its own electrical operation.
Source notes: 3. Editorial interpretation and illustrative calculations are identified separately.
A heat budget connects power with time
Here is a deliberately simplified, hypothetical example. Suppose an instrument assembly has an effective heat capacity of 600 joules per degree Celsius, and receives a constant net heat input of two watts. A watt is a joule per second. Over 3,600 seconds, it receives 2 × 3,600 = 7,200 joules.
Dividing 7,200 by 600 gives a 12°C rise. Doubling the assumed net input to four watts gives a 24°C rise over the same period. These are invented inputs, not DAVINCI measurements, performance predictions or published instrument margins.
The example shows why duration and heat leakage belong together. A temperature headline leaves both out. Real hardware has multiple components, changing heat paths and unequal temperatures, so a single lumped calculation is only a reading aid. It cannot replace measured temperatures or a validated thermal model.
Source notes: 4. Editorial interpretation and illustrative calculations are identified separately.
Small connections can carry significant heat
A historical NASA thermal presentation describes an earlier development sphere with insulation and internal mass simulators. Comparing its model with measurements showed stronger internal convection than initially assumed. This is background on the development method, not a numerical result from the 2026 campaign.
Our practical interpretation is that the whole assembly matters. Heat can cross insulation, travel through supports or enter around openings. Restricting one path may make another relatively more important. A diagram of a well-insulated wall therefore does not settle the temperature of equipment attached to that wall.
Representing instruments with other hardware makes a development experiment possible, but the representation must match the question. Matching mass alone would not automatically match heat capacity, contact paths or electrical heat generation. The relevant comparison is the thermal behavior that the experiment intends to reproduce.
Source notes: 4. Editorial interpretation and illustrative calculations are identified separately.
Thermal evidence and pressure evidence answer different questions
Heating challenges temperature control. External pressure challenges the vessel, joints and seals. They can interact, but passing a reported heat sequence does not automatically establish performance under every pressure history. The September account does not supply the pressure conditions needed for that broader conclusion.
A useful test description should identify which loads were reproduced together and which were examined separately. This is our proposed way to read the evidence, not a claim that the DAVINCI team omitted necessary work. Separate experiments can answer separate questions; a full assessment needs a clear account of how their results connect.
Likewise, an engineering model and the eventual flight payload have different evidential roles. Successful development testing informs the design. Demonstrating the assembled flight system’s behavior requires evidence tied to that actual configuration and its requirements.
Source notes: 2, 3. Editorial interpretation and illustrative calculations are identified separately.
The strongest follow-up would show the temperature margins
Our proposed next reading would start with time-stamped chamber, shell and instrument temperatures, alongside the permitted range for each monitored component. We would ask how closely the imposed heating followed the intended profile, how sensor uncertainty was handled and whether repeated runs produced comparable results.
Then compare model predictions made before a run with that run’s measurements. Adjusting a model to reproduce observations is useful calibration; checking its predictions against additional conditions asks a further question. Explaining that distinction helps readers assess what a successful experiment has actually taught the team.
Lumacta did not operate the furnace, inspect original sensor records or test flight instruments. The available report supports a meaningful thermal-development milestone. Its wider value is an engineering lesson readers can carry elsewhere: survival depends on the route heat takes and the time available, not simply the highest temperature printed beside a photograph.
Source notes: 2, 4. Editorial interpretation and illustrative calculations are identified separately.
Sources & Methods
Prepared October 5, 2026. We read the October 2 photo article, September 24 test account and current mission page, plus the publicly hosted historical thermal presentation. Dates refer separately to publication and testing; the exact photograph capture date is undisclosed. The presentation carries older slide dates and is used only as historical background. The heat-budget arithmetic and evaluation questions are Lumacta’s original explanation, not test results, a mission simulation, a reanalysis of sensor data or an expert interview. The documentary photograph was downloaded and inspected; no generated image or simulation is used.
- NASA: DAVINCI probe can stand the heat — Primary photo report, October 2, 2026; image credit
- NASA: DAVINCI beats heat in preparation for Venus descent — Primary test account published September 24, 2026 and updated September 25; six cycles, instrument simulators and sensor count
- NASA: DAVINCI mission — Current primary mission description read October 5, 2026; planned measurements and below-cloud imaging
- NASA: full-scale EDU descent-sphere thermal insulation tests — Public NASA technical presentation read October 5, 2026; historical insulation, mass simulators and comparison of models with measurements; older slide dates do not describe the 2026 test