
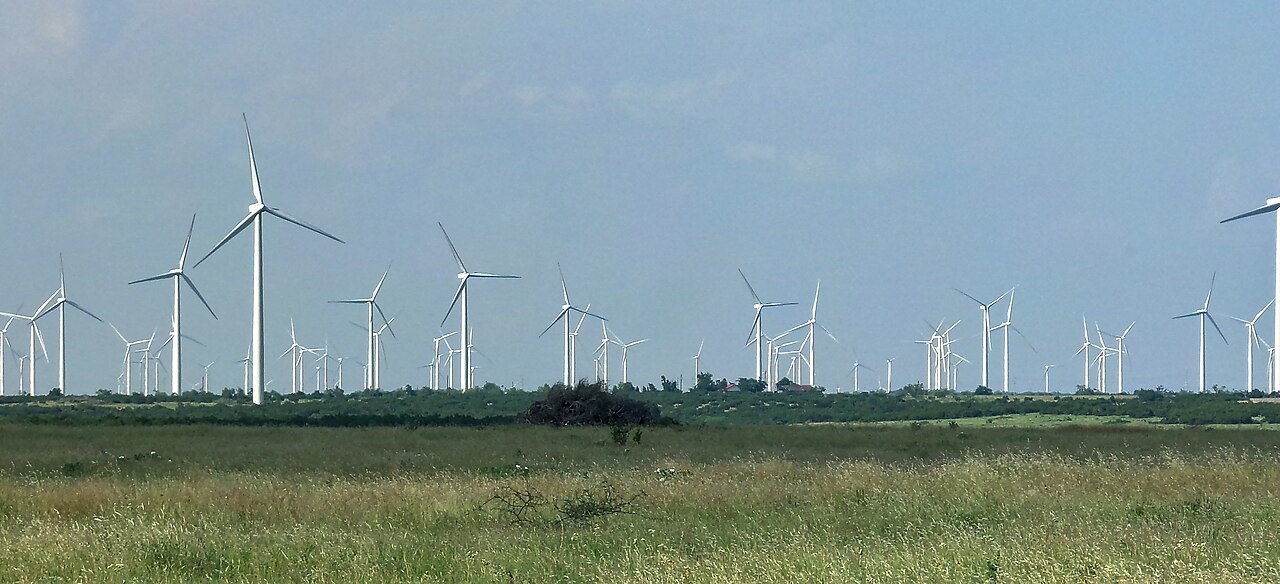
The small machine addresses a large testing problem
A September 28 MIT feature describes a 15-centimetre laboratory turbine used to study control settings under pressurised airflow. The underlying PNAS Nexus study, published September 7, reports experiments at pressures up to 220 atmospheres. Its abstract describes commercially relevant flow conditions and a predictive model for different operating strategies.
The result matters because changing a turbine’s alignment and rotational setting changes the flow around its blades. Testing those choices on an ordinary miniature rotor does not necessarily reproduce the conditions a much larger rotor encounters. This experiment aims to make the comparison more physically representative, not just more visually convincing.
Lumacta has read the journal abstract and institutional reporting, not reprocessed the measurements or conducted a turbine test. The work should be presented as laboratory and modelling evidence. Calling it a proven increase in every wind farm’s production would move beyond what these sources establish.
Source notes: 1, 2. Analysis and hypothetical examples are identified in the text.
Why squeezing the air helps a model behave at full scale
NASA’s aerodynamics reference explains the Reynolds number as the ratio of inertial to viscous effects. In its usual form it depends on air density, speed, characteristic length and viscosity. A smaller model changes the length term, so a geometrically accurate copy can still operate in a different flow regime.
Raising the density gives researchers another way to approach the desired similarity conditions. That is the purpose of pressurisation here. It should not be confused with a proposal to put commercial wind farms inside pressure vessels. The chamber is a testing environment, not the new design of a field turbine.
Our engineering interpretation is that good scale modelling preserves the relationships governing the phenomenon being studied. Matching the shape is only one part. Matching relevant flow conditions improves the meaning of a comparison, while leaving other questions—such as changing outdoor conditions—to separate tests.
Source notes: 3. Analysis and hypothetical examples are identified in the text.
The best rotational setting can change when the rotor turns
The study’s abstract reports that the optimal tip-speed ratio varies with yaw angle. Tip-speed ratio compares the speed of a blade’s tip with the incoming wind speed; yaw angle describes rotor misalignment with that wind. The researchers also report that their Unified Wind Turbine model predicts the experimental results across the examined strategies.
The practical implication is a coupled control problem. Rotational speed and alignment should not automatically be treated as unrelated choices. A setting that works well under one alignment may not remain the preferred setting under another. That is a more useful result than a generic instruction to “turn the turbine towards the wind”.
Our proposed next question for a supplier is how those relationships enter its controller. Does it use a fixed rule, a measured lookup or a model that is checked against operating data? The answer would connect laboratory understanding to actual decision-making. We have not inspected a manufacturer’s controller or verified a field implementation.
Source notes: 1, 2. Analysis and hypothetical examples are identified in the text.
The goal is a better farm, not just a better-looking rotor result
MIT’s report presents the work as a possible route to more effective wind-farm operation. Our interpretation is that a farm-level claim needs a farm-level measurement. Improving one rotor’s behaviour under a controlled condition does not by itself establish the annual output of a collection of machines.
A fair comparison should hold the reference conditions and measurement period visible. It should count available wind, shutdowns, maintenance and the settings actually applied. Otherwise, a windier period could make an unchanged controller appear better, or an unrelated outage could hide a genuine control improvement.
There is also a difference between an aerodynamic opportunity and an operational decision. A controller needs to respond within equipment limits and the site’s operating requirements. Before adoption, an operator should ask whether the proposed change has been assessed for its own machines, not assume that a small laboratory apparatus certifies every installation.
Source notes: 1, 2. Analysis and hypothetical examples are identified in the text.
A small percentage can matter—but the percentage must be earned
Here is a hypothetical illustration, not a result from the study: a wind farm producing 100 gigawatt-hours a year would gain one gigawatt-hour from a genuine 1% improvement. At an assumed realised value of $50 per megawatt-hour, that additional 1,000 megawatt-hours would be worth $50,000 before added costs.
The calculation explains why incremental optimisation attracts attention. It does not forecast a particular site’s revenue. Both the improvement and the energy value are chosen assumptions; the study’s laboratory findings do not provide them for a reader’s farm. Implementation, verification and maintenance costs would also need to be counted.
Lumacta would therefore ask for a net result rather than only a headline percentage. What is the baseline, how much uncertainty surrounds the difference and what must the operator spend to obtain it? A modest gain with a credible measurement may be more useful than a much larger estimate without those details.
Source notes: 1. Analysis and hypothetical examples are identified in the text.
The strength is testable physics, not a universal saving
Our scientific perspective is that controlled similarity experiments can help separate causes that become entangled outdoors. Change an operating variable, observe the response and compare it with a prediction. Agreement strengthens the model within the tested conditions; disagreement identifies something the explanation has not captured.
The next evidential step would be an independent comparison under documented field conditions. A useful report would state the control version, reference strategy, measurement uncertainty and conditions where it stops performing well. These are proposed validation requirements, not results we can report from the abstract.
The takeaway is an engineering advance in how turbine decisions can be tested. It could help make better use of existing machines, but its value is not established by the pressure figure alone. The convincing outcome would be a repeatable improvement in accepted operation, with the limitations left visible.
Source notes: 2, 3. Analysis and hypothetical examples are identified in the text.
Sources & Methods
Prepared September 30, 2026. We read the September 28 MIT feature, the PNAS Nexus abstract and publication record, and NASA’s Reynolds-number reference. The journal page identifies an accepted manuscript before final copyediting. We did not analyse raw data, perform a field test or independently validate a farm-level gain. The energy-value example is our arithmetic using disclosed assumptions.
- MIT: pressurised experiments could help wind farms generate more power — Institutional report dated September 28, 2026
- PNAS Nexus: full dynamic similarity experiments and predictive modelling — Primary research abstract and publication record, September 7, 2026; DOI 10.1093/pnasnexus/pgag303
- NASA Glenn: Reynolds number — Primary technical explanation of aerodynamic similarity, not an assessment of this experiment