
The report is new; the seasonal turning point is earlier
The October 12 NASA feature reports that Antarctic sea ice likely reached its annual maximum on September 14, covering 17.59 million square kilometres by extent. That ranks third-lowest among annual maxima. It is neither a record-low maximum nor a measurement of conditions on publication day.
Our first reading rule is to separate three timestamps: when the physical event occurred, when an analysis identified it and when an article reported it. A fresh publication can illuminate an earlier observation. Confusing those dates makes a perfectly legitimate update sound like an event that has just happened.
The second rule is to retain the qualifier. Likely is part of this reported conclusion, not decoration to remove from a headline. Readers deserve the observation and its confidence together. There is no need to strengthen the claim artificially for the seasonal ranking to be significant.
Source notes: 1. Original editorial examples and interpretations are identified separately.
A turning point is easier to identify after the curve continues
NSIDC’s September 23 preliminary announcement identified the candidate maximum, while warning that large fluctuations near the peak delayed confident identification. Its ranking was conditional on that date holding. That distinction matters when reading a seasonal bulletin rather than just extracting its largest number.
Consider the problem without inventing a satellite result. If a plotted value falls after a high point, that point is only a candidate peak while further observations are pending. A subsequent rebound could overtake it. Reporting the candidate early and revisiting it later are different stages of evidence.
This is why a cautious bulletin is not necessarily indecision or a correction. Our editorial checklist asks whether an update changes the number, the ranking or only confidence in the timing. We do not infer a final confirmation merely because an earlier announcement promised another analysis.
Source notes: 2. Original editorial examples and interpretations are identified separately.
The measured footprint is not the amount of ice
NSIDC distinguishes extent from area: extent counts whole qualifying grid cells, while area weights them by ice concentration. Its calculations exclude cells below 15 percent concentration. Neither measure supplies thickness; a footprint should not be relabelled as ice volume.
The practical reading habit is to write the variable beside every number before comparing it with another. An extent figure cannot be compared directly with an area figure as though they describe identical quantities. Similar units do not make the definitions interchangeable. The question being answered still matters.
For our interpretation, this is not a reason to dismiss the measurement. A consistent rule makes observations comparable. It is a reason to keep the rule visible and to seek additional evidence when the question changes from how widely ice is distributed to how much material exists.
Source notes: 3. Original editorial examples and interpretations are identified separately.
A small concentration change can cross a counting boundary
Here is an original, hypothetical teaching example, not an Antarctic observation. Give one imaginary grid cell an area of 100 square kilometres. At 14 percent concentration, its physical ice-covered portion is 14 square kilometres, but the cell contributes zero to extent under a 15 percent threshold.
At 16 percent, the physical ice-covered portion is 16 square kilometres and the extent contribution becomes 100. In this invented cell, the ice-covered portion grows by 2 square kilometres while the counted extent grows by 100. Those are different answers to different questions, not contradictory arithmetic.
Crucially, the 14-square-kilometre physical portion is not a reported sea-ice-area product: the operational calculation also excludes below-threshold cells. We have not specified a real sensor grid, estimated measurement error or reconstructed the published dataset. The exercise only shows why a counting boundary belongs in the explanation.
Source notes: 3. Original editorial examples and interpretations are identified separately.
One seasonal position cannot do every job of a climate analysis
The NASA feature describes earlier Antarctic extent growth followed by more recent low years and notes that researchers are examining whether the decline persists. Its historical context is broader than this single maximum; we do not replace that context with one dramatic rank.
Our scientific interpretation separates description, trend and attribution. Description tells us where an observation sits in a defined series. A trend requires an appropriate time span and a documented method. Attribution asks why a pattern occurred. A short headline cannot make those three questions equivalent simply by placing them together.
Neither a low seasonal ranking nor a later rebound should be treated as a self-contained verdict on long-term change. A useful follow-up would inspect consistent records and the uncertainties attached to the analysis. This article offers a reading framework, not a new attribution study or a climate forecast.
Source notes: 1. Original editorial examples and interpretations are identified separately.
Use an honest photograph and ask a better follow-up question
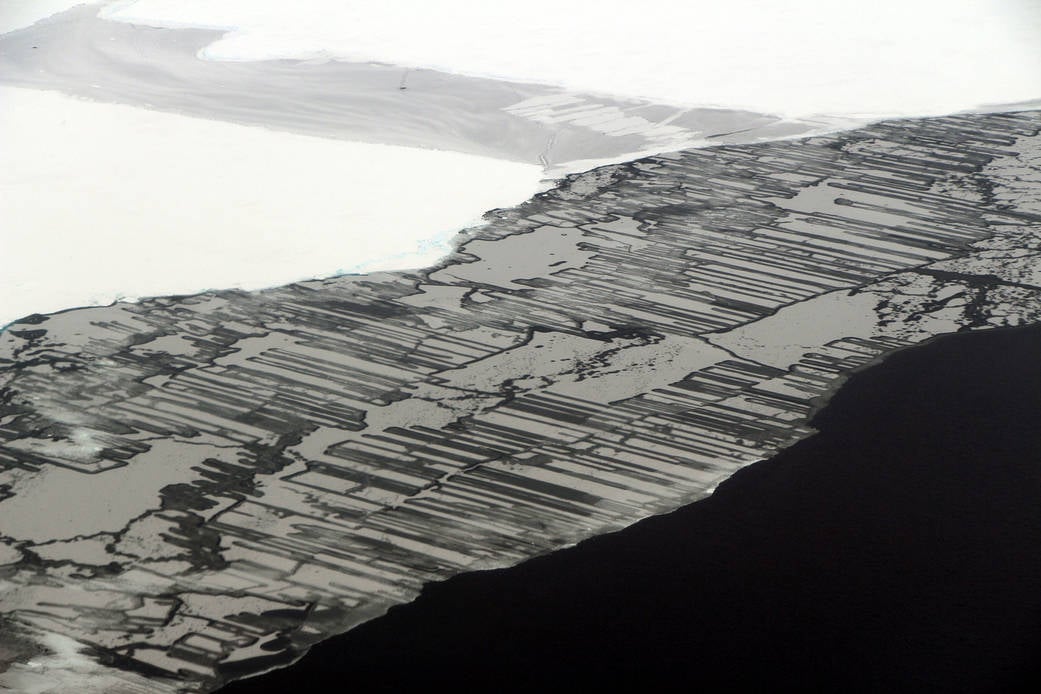
The accompanying real photograph was taken by John Sonntag over the Weddell Sea on November 14, 2017, during Operation IceBridge. It is archival visual context, not evidence of the September 2026 maximum. We keep its capture date separate from the news date.
A striking picture can help a reader recognise the subject but cannot certify a continent-wide seasonal ranking. Our reporting therefore keeps the image’s role separate from the measurement’s role. The photograph illustrates; the documented observation supports the numerical claim. Neither substitutes for the other.
The next useful question is what additional evidence would change the interpretation, not whether the headline can become more alarming. Follow the defined measure, distinguish seasonal milestones from longer records and preserve the uncertainty. That makes the update more informative without pretending Lumacta independently measured the ice.
Source notes: 4. Original editorial examples and interpretations are identified separately.
Sources & Methods
Prepared October 13, 2026. We read the complete October 12 NASA feature, September 23 NSIDC preliminary announcement and NSIDC’s June 13, 2022 area/extent explainer. The NASA photograph record and media-use policy were also read. The hypothetical grid-cell arithmetic and reporting checklists are original editorial explanations. No satellite dataset was downloaded or reprocessed, no field observation or interview was performed, and no attribution analysis or climate forecast was produced by Lumacta. The 2017 archive photograph is not a picture of the 2026 observation.
- NASA: Antarctic sea ice grows to its 2026 maximum — Primary institutional feature, October 12, 2026; complete body read
- NSIDC: preliminary seasonal turning points — Primary announcement, September 23, 2026; complete body read
- NSIDC: the difference between sea-ice area and extent — Primary measurement explainer, updated June 13, 2022; complete body read
- NASA: The Beauty of Ice — Primary photograph record, November 22, 2017; complete body read